Difference between revisions of "Decision Management"
| Line 21: | Line 21: | ||
===Developing Objectives and Measures=== | ===Developing Objectives and Measures=== | ||
Defining how an important decision will be made is difficult. As Keeney puts it: | Defining how an important decision will be made is difficult. As Keeney puts it: | ||
| − | <blockquote>Most important decisions involve multiple objectives, and usually with multiple-objective decisions, you can't have it all. You will have to accept less achievement in terms of some objectives in order to achieve more on other objectives. But how much less would you accept to achieve how much more? (Keeney 2002)</blockquote> | + | <blockquote>''Most important decisions involve multiple objectives, and usually with multiple-objective decisions, you can't have it all. You will have to accept less achievement in terms of some objectives in order to achieve more on other objectives. But how much less would you accept to achieve how much more?'' (Keeney 2002)</blockquote> |
The first step is to develop objectives and measures using interviews and focus groups with subject matter experts (SMEs) and stakeholders. | The first step is to develop objectives and measures using interviews and focus groups with subject matter experts (SMEs) and stakeholders. | ||
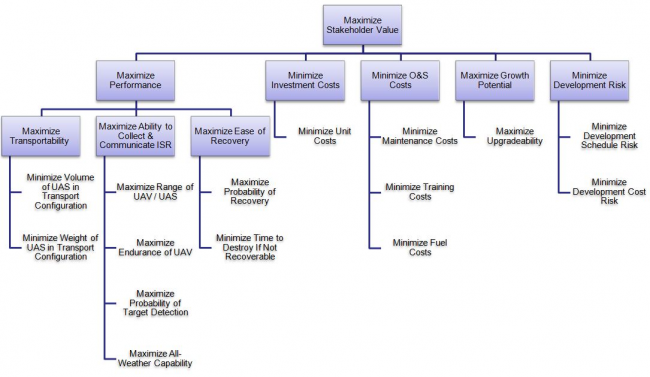
For systems engineering trade-off analyses, stakeholder value often includes competing objectives of performance, development schedule, unit cost, support costs, and growth potential. For corporate decisions, shareholder value would also be added to this list. For performance, a functional decomposition can help generate a thorough set of potential objectives. Test this initial list of fundamental objectives by checking that each fundamental objective is essential and controllable and that the set of objectives is complete, non-redundant, concise, specific, and understandable. (Edwards et al. 2007) Figure 2 provides an example of an objectives hierarchy. | For systems engineering trade-off analyses, stakeholder value often includes competing objectives of performance, development schedule, unit cost, support costs, and growth potential. For corporate decisions, shareholder value would also be added to this list. For performance, a functional decomposition can help generate a thorough set of potential objectives. Test this initial list of fundamental objectives by checking that each fundamental objective is essential and controllable and that the set of objectives is complete, non-redundant, concise, specific, and understandable. (Edwards et al. 2007) Figure 2 provides an example of an objectives hierarchy. | ||
Revision as of 16:47, 5 November 2013
Many systems engineering decisions are difficult because they include numerous stakeholders, multiple competing objectives, substantial uncertainty, and significant consequences. In these cases, good decision making requires a formal decision management process. The purpose of the decision management process is:
“…to provide a structured, analytical framework for identifying, characterizing and evaluating a set of alternatives for a decision at any point in the life-cycle and select the most beneficial course of action.” (ISO/IEC 15288:2008)
Decision situations (opportunities) are commonly encountered throughout a system’s lifecycle. The decision management method most commonly employed by systems engineers is the trade study. Trade studies aim to define, measure, and assess shareholder and stakeholder value to facilitate the decision maker’s search for an alternative that represents the best balance of competing objectives. By providing techniques for decomposing a trade decision into logical segments and then synthesizing the parts into a coherent whole, a decision management process allows the decision maker to work within human cognitive limits without oversimplifying the problem. Furthermore, by decomposing the overall decision problem, experts can provide assessments of alternatives in their area of expertise.
Decision Management Process
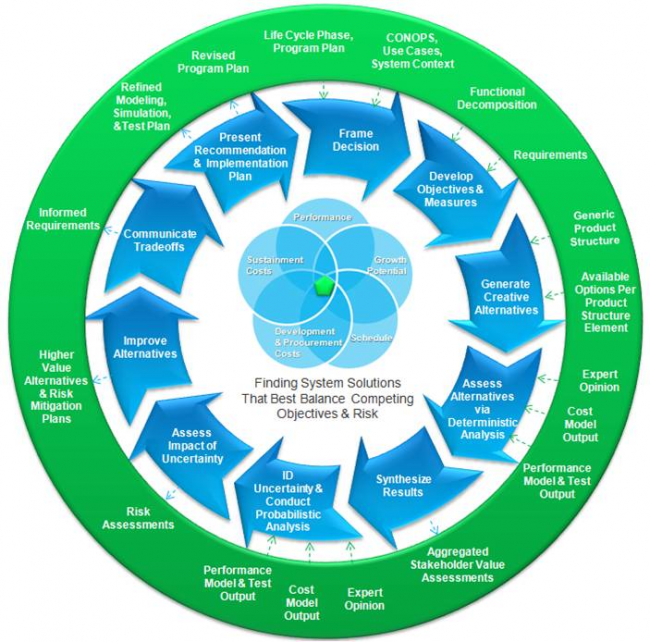
The decision analysis process is depicted in Figure 1 below. The decision management process is based on several best practices, including:
- Utilizing sound mathematical technique of decision analysis for trade off studies (Parnell, 2009) provided a list of decision analysis concepts and techniques).
- Developing one master decision model, followed by its refinement, update, and use, as it required for trade studies throughout the system life cycle.
- Using Value-Focused Thinking (Keeney, 1992) to create better alternatives.
- Identifying uncertainty and assessing risks for each decision.
The center of the diagram shows the five trade space objectives. The ten blue arrows represent the decision management process activities and the white text within the green ring represents SE process elements. Interactions are represented by the small, dotted green or blue arrows. The decision analysis process is an iterative process. A hypothetical UAV decision problem is used to illustrate each of the activities in the following sections.
Framing and Tailoring the Decision
To ensure the decision team fully understands the decision context, the analyst should describe the system baseline, boundaries and interfaces. The decision context includes: the system definition, the life cycle stage, decision milestones, a list of decision makers and stakeholders, and available resources. The best practice is to identify a decision problem statement that defines the decision in terms of the system life cycle.
Developing Objectives and Measures
Defining how an important decision will be made is difficult. As Keeney puts it:
Most important decisions involve multiple objectives, and usually with multiple-objective decisions, you can't have it all. You will have to accept less achievement in terms of some objectives in order to achieve more on other objectives. But how much less would you accept to achieve how much more? (Keeney 2002)
The first step is to develop objectives and measures using interviews and focus groups with subject matter experts (SMEs) and stakeholders. For systems engineering trade-off analyses, stakeholder value often includes competing objectives of performance, development schedule, unit cost, support costs, and growth potential. For corporate decisions, shareholder value would also be added to this list. For performance, a functional decomposition can help generate a thorough set of potential objectives. Test this initial list of fundamental objectives by checking that each fundamental objective is essential and controllable and that the set of objectives is complete, non-redundant, concise, specific, and understandable. (Edwards et al. 2007) Figure 2 provides an example of an objectives hierarchy.
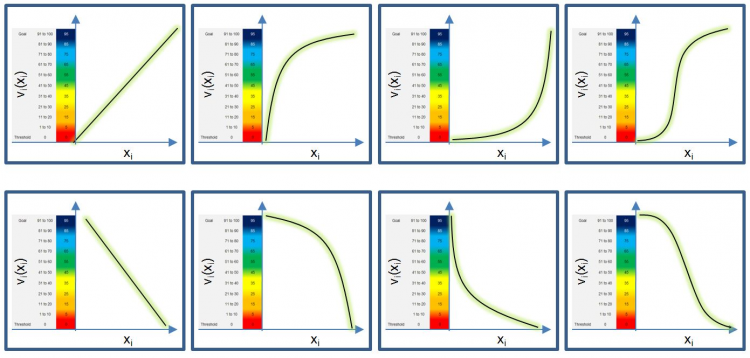
For each objective, we define a measure to assess the value of each alternative for that objective. A measure (attribute, criterion, and metric) must be unambiguous, comprehensive, direct, operational, and understandable (Keeney & Gregory 2005). A defining feature of multi-objective decision analysis is the transformation from measure space to value space. This transformation is performed by a value function which shows returns to scale on the measure range. When creating a value function, we ascertain the walk-away point on the measure scale (x-axis) and map it to a 0 value on the value scale (y-axis). A walk-away point is the measure score where regardless of how well an alternative performs in other measures, the decision maker will walk away from the alternative. He or she does this through working with the user, finding the measure score beyond, at which point an alternative provides no additional value, and labeling it "stretch goal" (ideal) and then mapping it to 100 (or 1 and 10) on the value scale (y-axis). Figure 3 provides the most common value curve shapes. The rationale for the shape of the value functions should be documented for traceability and defensibility (Parnell et al. 2011).
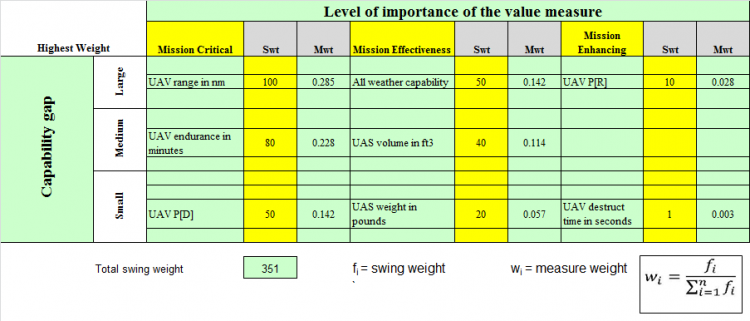
The mathematics of multiple objective decision analysis (MODA) requires that the weights depend on importance of the measure and the range of the measure (walk away to stretch goal). A useful tool for determining priority weighting is the swing weight matrix (Parnell et al. 2011). For each measure, consider its importance through determining whether the measure corresponds to a defining, critical, or enabling function and consider the gap between the current capability and the desired capability; finally, put the name of the measure in the appropriate cell of the matrix (Figure 4). The highest priority weighting is placed in the upper-left corner and assigned an unnormalized weight of 100. The unnormalized weights are monotonically decreasing to the right and down the matrix. Swing weights are then assessed by comparing them to the most important value measure or another assessed measure. The swing weights are normalized to sum to one for the additive value model used to calculate value in a subsequent section.
Generating Creative Alternatives
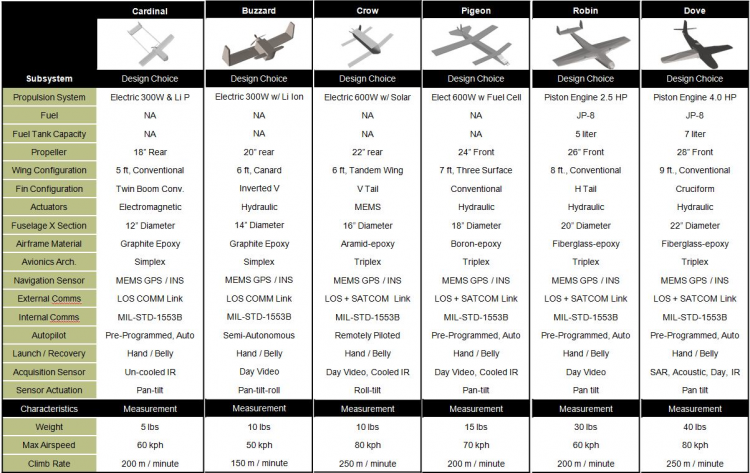
To help generate a creative and comprehensive set of alternatives that span the decision space, consider developing an alternative generation table (also called a morphological box) (Buede, 2009; Parnell et al. 2011). It is a best practice to establish a meaningful product structure for the system and to be reported in all decision presentations (Figure 5).
Assessing Alternatives via Deterministic Analysis
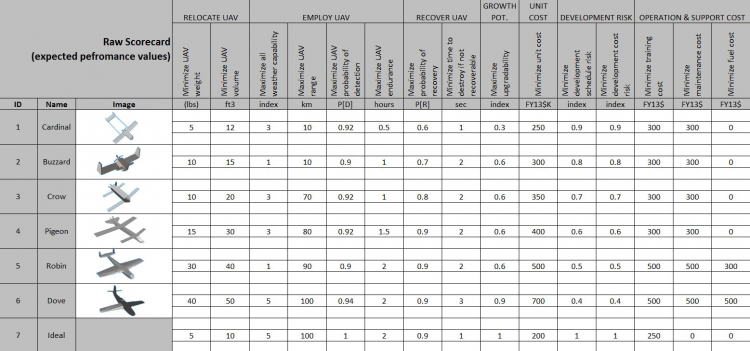
With objectives and measures established and alternatives having been defined, the decision team should engage SMEs, equipped with operational data, test data, simulations, models, and expert knowledge. Scores are best captured on scoring sheets for each alternative/measure combination which document the source and rationale. Figure 6 provides a summary of the scores.
Note that in addition to identified alternatives, the score matrix includes a row for the ideal alternative. The ideal is a tool for value-focused thinking, which will be covered later.
Synthesizing Results
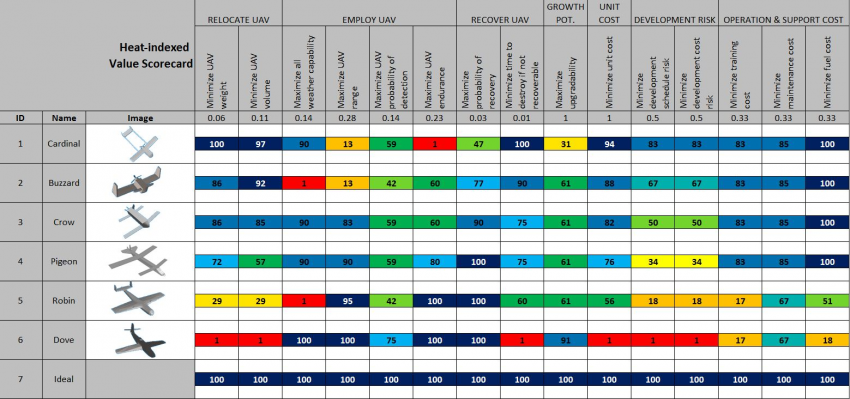
Next, one can transform the scores into a value table, by using the value functions developed previously. A color heat map can be useful to visualize value tradeoffs between alternatives and identify where alternatives need improvement (Figure 7).
The additive value model uses the following equation to calculate each alternative’s value:
EQUATION HERE
where
EQUATION VALUES HERE
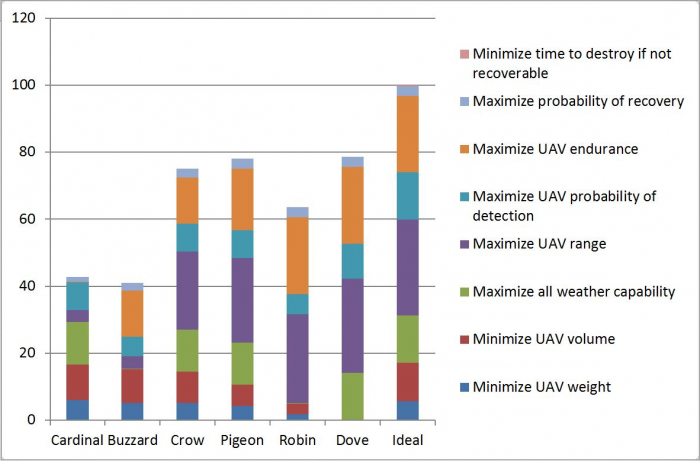
The value component chart (Figure 8) shows the total value and the weighted value measure contribution of each alternative (Parnell et al. 2011).
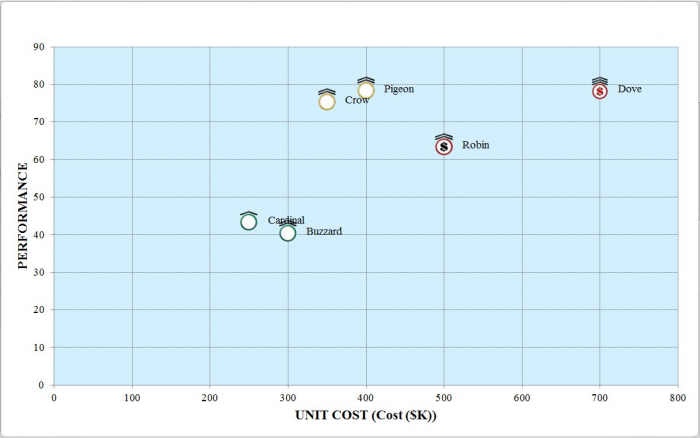
The heart of a decision management process for system engineering trade off analysis is the ability to assess all dimensions of shareholder and stakeholder value. The stakeholder value scatter plot in Figure 9 shows five dimensions: unit cost, performance, development risk, growth potential, and operation and support costs for all alternatives.
Each system alternative is represented by a scatter plot marker (Figure 9). An alternative’s unit cost and performance value are indicated by x and y positions respectively. An alternative’s development risk is indicated by the color of the marker (green = low, yellow= medium, red = high), while the growth potential is shown as the number of hats above the circular marker (1 hat = low, 2 hats = moderate, 3 hats = high).
Identifying Uncertainty and Conducting Probabilistic Analysis
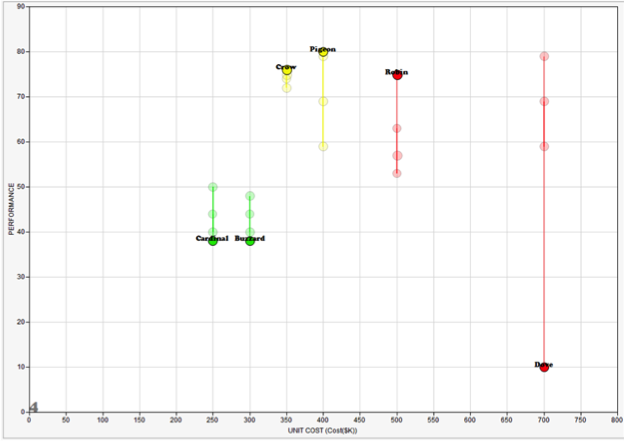
As part of the assessment, the SME should discuss the potential uncertainty of the independent variables. The independent variables are the variables that impact one or more scores; the scores that are independent scores. Many times the SME can assess an upper, nominal, and lower bound by assuming low, moderate, and high performance. Using this data, a Monte Carlo Simulation summarizes the impact of the uncertainties and can identify the uncertainties that have the most impact on the decision.
Accessing Impact of Uncertainty - Analyzing Risk and Sensitivity
Decision analysis uses many forms of sensitivity analysis including line diagrams, tornado diagrams, waterfall diagrams and several uncertainty analyses including Monte Carlo Simulation, decision trees, and influence diagrams (Parnell et al. 2013). A line diagram is used to show the sensitivity to the swing weight judgment (Parnell et al. 2011). Figure 10 shows the results of a Monte Carlo Simulation of performance value.
Improving Alternatives
Mining the data generated for the alternatives will likely reveal opportunities to modify some design choices to claim untapped value and/or reduce risk. Taking advantage of initial findings to generate new and creative alternatives starts the process of transforming the decision process from "alternative-focused thinking" to "value-focused thinking" (Keeney 1993).
Communicating Tradeoffs
This is the point in the process where the decision analysis team identifies key observations about tradeoffs and the important uncertainties and risks.
Presenting Recommendations and Implementing Action Plan
It is often helpful to describe the recommendation(s) in the form of a clearly-worded, actionable task-list in order to increase the likelihood of the decision implementation. Reports are important for historical traceability and future decisions. Take the time and effort to create a comprehensive, high-quality report detailing study findings and supporting rationale. Consider static paper reports augmented with dynamic hyper-linked e-reports.
References
Works Cited
Buede, D.M. 2009. The Engineering Design of Systems: Models and Methods, Wiley.
Edwards, W., Miles Jr, R.F. & Von Winterfeldt, D. 2007. Advances In Decision Analysis: From Foundations to Applications, Cambridge University Press.
Keeney, R.L. and Raiffa H. 1976. Decisions with Multiple Objectives - Preferences and Value Tradeoffs. New York: Wiley.
Keeney, R.L. 1992. Value-Focused Thinking: A Path to Creative Decision-making. Cambridge, Massachusetts: Harvard University Press.
Keeney, R.L. 1993. Creativity in MS/OR: Value-focused thinking—Creativity directed toward decision making. Interfaces, 23(3), pp.62–67.
Parnell, G. S. 2009. Decision Analysis in One Chart, Decision Line, Newsletter of the Decision Sciences Institute.
Parnell, G. S., Driscoll, P. J., and Henderson D. L., (eds). 2011. Decision Making for Systems Engineering and Management, 2nd Edition, Wiley Series in Systems Engineering, Wiley & Sons Inc.
Parnell, G., Bresnick, T., Tani, S., & Johnson, E. 2013. Handbook of Decision Analysis, Wiley & Sons.
Primary References
Buede, D.M. 2004. On Trade Studies, INCOSE.
Keeney, R.L. 2004. Making Better Decision Makers. Decision Analysis, 1(4), pp.193–204.
Keeney, R.L. & Gregory, R.S. 2005. Selecting Attributes to Measure the Achievement of Objectives. Operations Research, 53(1), pp.1–11.
Kirkwood, C. W. 1197. Strategic Decision Making: Multiobjective Decision Analysis with Spreadsheets, Belmont, California: Duxbury Press.
Additional References
Buede, D.M. & Choisser, R.W. 1992. Providing an Analytic Structure for Key System Design Choices. Journal of Multi-Criteria Decision Analysis, 1(1), pp.17–27.
Felix, A. 2004. Standard Approach to Trade Studies, INCOSE.
Felix, A. 2005. How the Pro-Active Program (Project) Manager Uses a Systems Engineer’s Trade Study as a Management Tool, and not just a Decision Making Process, INCOSE.
Miller, G.A. 1956. The Magical Number Seven, Plus or Minus Two: Some Limits on Our Capacity for Processing Information. Psychological Review, 63(2), p.81.
Ross, A.M. and Hastings, D.E. 2005. Tradespace Exploration Paradigm, INCOSE.
Sproles, N. 2002. Formulating Measures of Effectiveness, INCOSE.
Silletto, H. 2005. Some Really Useful Principles: A new look at the scope and boundaries of systems engineering, INCOSE.
Ullman, D.G. and Spiegel, B.P. 2006. Trade Studies with Uncertain Information, INCOSE.
SEBoK Discussion
Please provide your comments and feedback on the SEBoK below. You will need to log in to DISQUS using an existing account (e.g. Yahoo, Google, Facebook, Twitter, etc.) or create a DISQUS account. Simply type your comment in the text field below and DISQUS will guide you through the login or registration steps. Feedback will be archived and used for future updates to the SEBoK. If you provided a comment that is no longer listed, that comment has been adjudicated. You can view adjudication for comments submitted prior to SEBoK v. 1.0 at SEBoK Review and Adjudication. Later comments are addressed and changes are summarized in the Letter from the Editor and Acknowledgements and Release History.
If you would like to provide edits on this article, recommend new content, or make comments on the SEBoK as a whole, please see the SEBoK Sandbox.
blog comments powered by Disqus