Uncategorized files
Jump to navigation
Jump to search
Showing below up to 100 results in range #51 to #150.
View (previous 100 | next 100) (20 | 50 | 100 | 250 | 500)
 Caltech LOGO-Orange RGB.png 1,486 × 360; 38 KB
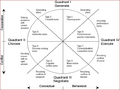
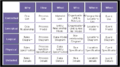
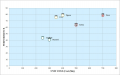
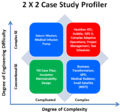 Casestudies-2x2.png 617 × 574; 32 KB
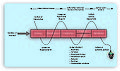 Chap4 fig 1 new.jpg 439 × 261; 28 KB
 Chap4 fig 1 new.png 1,871 × 1,138; 146 KB
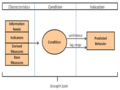
 Chap4 fig 1 new Layer 1.png 439 × 261; 12 KB
 Chemical Interactions, Phenomena, Principles.png 461 × 134; 68 KB
 ChoeKimFigure1.png 747 × 331; 44 KB
 ChoeKimFigure2.png 841 × 107; 21 KB
 ChoeKimFigure3.png 983 × 277; 32 KB
 ChoeKimFigure4.png 723 × 396; 106 KB
 ChoeKimFigure5.png 506 × 361; 81 KB
 ChoeKimTABLE1.png 1,069 × 620; 45 KB
- Error creating thumbnail: File missingChris profile picture ESEP.png 1,200 × 900; 978 KB
 Circumplex Model of Group Tasks.PNG 626 × 470; 62 KB
 Circumplex Model of Group Tasks.png 626 × 470; 62 KB
 Clif baldwin editors bio photo.jpg 1,439 × 1,798; 362 KB
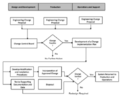 Cm change control process.png 529 × 427; 53 KB
 Cm functions.png 411 × 460; 83 KB
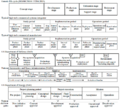 Comparisons of life cycle models.PNG 1,038 × 931; 248 KB
 Component Lifecycle (rev a) - MJB ver2.jpg 2,079 × 250; 263 KB
 Composition of Leading Indicator-Figure 2.png 964 × 721; 269 KB
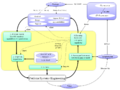 Concept map for businesses and enterprises topics.png 960 × 720; 68 KB
 Core SEBoK Concepts.PNG 620 × 391; 92 KB
 Culture competence team performance and individual competence.png 960 × 720; 60 KB
 DEI Figure1.png 591 × 472; 85 KB
 DEI Figure2.png 591 × 518; 214 KB
 DaveOlwell.jpg 1,400 × 2,100; 1.19 MB
 Decision Mgt Process DM.png 703 × 694; 624 KB
 Decision selection flowchart.png 1,364 × 869; 257 KB
 Decision tree example.png 565 × 380; 54 KB
 Decomposition of Functions AF 071112(2).png 1,134 × 750; 128 KB
 Definition and usage of a Validation Action.png 270 × 270; 19 KB
 Definition and usage of a Verification Action.png 284 × 214; 16 KB
 Delaurentis2019 450.jpg 450 × 600; 165 KB
 Descript of Alt DM.png 1,203 × 759; 709 KB
 Dimensions of Communication Styles.png 794 × 451; 80 KB
 Disruption Diagram.PNG 960 × 720; 7 KB
 Doc.jpg 128 × 128; 18 KB
 DownloadtheSEBoK.png 402 × 235; 46 KB
 ESE-F01.png 1,330 × 666; 61 KB
 ESE-F02.png 1,294 × 652; 48 KB
 ESE-F03.png 938 × 623; 176 KB
 ESE-F04.png 1,277 × 844; 21 KB
 ESE-F05.png 1,344 × 586; 37 KB
 ESE-F06.png 800 × 564; 49 KB
 ESE-F07.png 1,626 × 802; 64 KB
 ESE-F08.png 1,229 × 555; 26 KB
 ESE-F09.png 1,429 × 858; 59 KB
 ESE-F10.png 402 × 274; 50 KB
 ESE-F11.png 1,329 × 1,040; 54 KB
 ESE-F12.png 1,491 × 1,040; 63 KB
 ESE-F13.png 1,477 × 655; 56 KB
 ESE-F14.png 908 × 452; 88 KB
 ESE-F15.png 1,337 × 533; 256 KB
 ESE-F16.png 1,342 × 942; 412 KB
 ESE-F17.png 1,337 × 1,050; 68 KB
 ESE-F18.png 471 × 602; 276 KB
 ESE-F19.png 728 × 409; 33 KB
 ESE-F20.png 1,294 × 652; 48 KB
 ESE-F21.png 744 × 455; 52 KB
 ESE-F22.png 1,344 × 586; 37 KB
 ESE-F23.png 784 × 472; 332 KB
 ESE-F30 Process Breakdown.png 1,271 × 1,004; 79 KB
 ESE-TA.png 912 × 439; 39 KB
 ESE-TB.png 912 × 481; 39 KB
 Editor Signature Block.png 932 × 491; 105 KB
 EditorsinChiefSignatures.png 1,640 × 446; 314 KB
- Error creating thumbnail: File missingEleni Canez.jpg 116 × 139; 5 KB
 Ellipse Graphic J Ring.png 2,866 × 1,485; 576 KB
 EnablingSEFigure.png 900 × 566; 67 KB
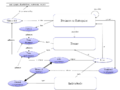
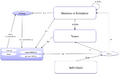
 Enterprise-ontology.PNG 650 × 337; 23 KB
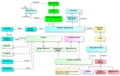
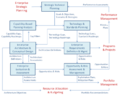
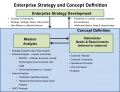 Enterprise Strategy and Concept Development.PNG 1,330 × 1,015; 194 KB
 Environmental Engineering HighRes.jpg 460 × 292; 71 KB
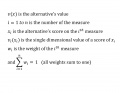
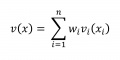 Eq 1.jpg 2,050 × 1,025; 52 KB
 Eq 2.jpg 2,200 × 1,700; 153 KB
 Equation 1 DM.png 86 × 35; 2 KB
- Error creating thumbnail: File missingEquation 1 Value DM.png 676 × 267; 44 KB
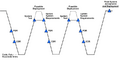 Evolutionary Generic Model.PNG 720 × 384; 46 KB
 Ex Itera of processes related to Sys Def AF 052312.png 1,117 × 502; 85 KB
 Ex Stakeholder Value Scat DM.png 1,199 × 750; 185 KB
 Example of Architected Agile Process Replacement 070912.png 1,240 × 540; 212 KB
 Examples of validated items.png 964 × 795; 260 KB
 Examples of verified items.png 1,051 × 762; 145 KB
 Fairley Fig 1 (2) Layer 1.png 439 × 205; 8 KB
 Fairley Fig 2 Layer 1.png 450 × 227; 12 KB
 Fault tree.jpg 519 × 526; 33 KB
 Fig. 1 Integration Process for Specialty Engineering.png 817 × 515; 160 KB
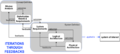
 Fig2 Systems Thinking and Systems Science RA.png 1,207 × 741; 107 KB
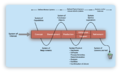
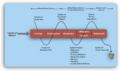
 Fig 1 A generic life cycle KF.png 1,209 × 177; 24 KB
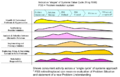 Fig 1 SA Activities Through Life RA.png 800 × 510; 115 KB
 Fig 1 System Fundamentals and Engineered Systems RA.png 1,445 × 1,086; 201 KB
 Fig 1 Systems Engineering and the Systems Approach RA.png 1,477 × 1,015; 224 KB
 Fig 1 Systems Science and Systems Thinking RA.png 1,196 × 1,042; 161 KB
 Fig 1 The relationships between key systems ideas and SE RA.jpg 1,497 × 1,103; 167 KB
 Fig 2 Life Cycle Stages Vee KF.png 1,316 × 979; 189 KB
 Fig 3 Complex Systems Engineering Diagram Sillitto2010.png 3,052 × 1,909; 732 KB
 Fig 3 Growing Industry Collaboration GR.png 1,402 × 967; 211 KB
 Figure1 systemsubsystem.png 1,783 × 916; 86 KB
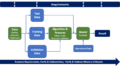 Figure2 MLprocess.png 2,002 × 1,104; 148 KB


.png)


_Layer_1.png)


_-_MJB_ver2.jpg)