Measurement
Introductory Paragraph(s)
Introduction
SE measurement and the accompanying analysis are fundamental elements of SE and technical management. SE measurement provides information relating to the products developed, services provided, and processes implemented to support effective management of the processes and to objectively evaluate product or service quality. This measurement supports realistic planning, provides insight into actual performance, and facilitates assessment of suitable actions. (Roedler and Jones 2005, 1-65; Frenz et al. 2010)
Appropriate measures and indicators are essential inputs to tradeoff analyses to balance cost, schedule and technical objectives. Periodic analysis of the relationships between measurement results and the requirements and attributes of the system provides insight that helps identify issues early, when they can be resolved with less impact. Historical data, together with project or organizational context information, forms the basis for predictive models and methods that should be used.
Fundamental Concepts
The discussion of measurement here is based on some fundamental concepts. Roedler, et al. states three key SE Measurement concepts that are paraphrased here (Roedler and Jones 2005, 1-65):
- SE measurement is a consistent but flexible process that is tailored to the unique information needs and characteristics of a particular project or organization and revised as information needs change.
- Decision makers must understand what is being measured. Key decision makers must be able to connect “what is being measured” to “what they need to know”.
- Measurement must be used to be effective.
Measurement Process Overview
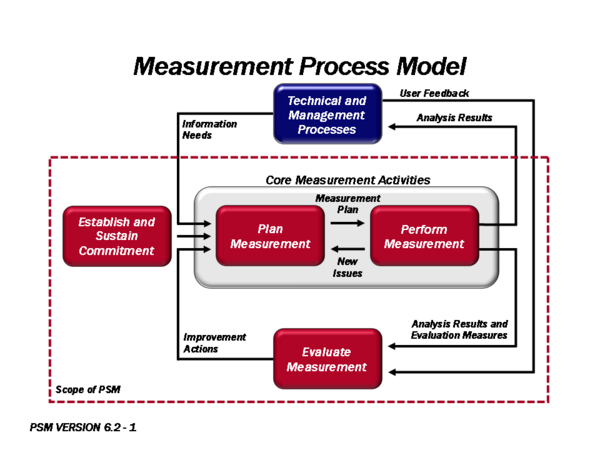
The measurement process as presented here consists of four activities from Practical Software and Systems Measurement (PSM) and described in (ISO/IEC/IEEE 15939), (McGarry, et al. 2002), and (Murdoch 2006, 67).
This process has been the basis for establishing a common process across the software and systems engineering communities. This measurement approach has been adopted by the Capability Maturity Model Integration (CMMI) measurement and analysis process area (SEI 2006, 10), and by international systems and software engineering standards, such as (ISO/IEC/IEEE 2008; ISO/IEC/IEEE 15939; ISO/IEC/IEEE 15288, 1). The International Council on Systems Engineering (INCOSE) Measurement Working Group has also adopted this measurement approach for several of their measurement assets, such as the INCOSE SE Measurement Primer (Frenz et al. 2010) and Technical Measurement Guide (Roedler and Jones 2005). This approach has provided a consistent treatment of measurement that allows the engineering community to communicate more effectively about measurement. The process is illustrated in Figure 1 from (Roedler and Jones 2005) and (McGarry, et al. 2002).
Figure 1. Four Key Measurement Process Activities (Source: (PSM August 18, 2011))
Establish and Sustain Commitment
This activity focuses on establishing the resources, training, and tools to implement a measurement process and ensure that there is management commitment to use the information that is produced. Refer to (PSM August 18, 2011) and (SPC 2011) for additional detail.
Plan Systems Engineering Measurement
This activity focuses on defining measures that provide insight into project or organization information needs. This includes identifying what the decision makers need to know, relating these information needs to those entities that can be measured, and then identifying, prioritizing, selecting, and specifying measures based on project and organization processes. (Jones 2003, 15-19)
There are a few widely used approaches to identify the information needs and derive associated measures. Each focuses on identifying measures that are needed for SE Management. These include:
- The PSM approach, which uses a set of information categories, measurable concepts, and candidate measures to aid the user in determining relevant information needs and aspects about the information needs on which to focus. (PSM August 18, 2011)
- The Goal-Question-Metric (GQM) approach, which identifies explicit measurement goals. Each goal is decomposed into several questions that help in the selection of measures that address the question and provide insight into the goal achievement. (Park, Goethert, and Florac 1996)
- Software Productivity Center’s 8-step Metrics Program, which also includes stating the goals and defining measures needed to gain insight for achieving the goals. (SPC 2011)
The following are good sources for candidate measures that address the information needs and measurable concepts/questions:
- PSM Web Site (PSM August 18, 2011)
- PSM Guide, Version 4.0, Chapters 3 and 5 (PSM 2000)
- SE Leading Indicators Guide, Version 2.0, Section 3 (Roedler et al. 2010)
- Technical Measurement Guide, Version 1.0, Section 10 (Roedler and Jones 2005, 1-65)
- Safety Measurement (PSM White Paper), Version 3.0, Section 3.4 (Murdoch 2006, 60)
- Security Measurement (PSM White Paper), Version 3.0, Section 7 (Murdoch 2006, 67)
- Measuring Systems Interoperability, Section 5 and Appendix C (Kasunic and Anderson 2004)
- Measurement for Process Improvement (PSM Technical Report), Version 1.0, Appendix E (Statz 2005)
The INCOSE SE Measurement Primer (Frenz et al. 2010) provides a list of attributes of a good measure with definitions for each attribute. The attributes include relevance, completeness, timeliness, simplicity, cost effectiveness, repeatability, and accuracy. Evaluating candidate measures against these attributes can help assure the selection of more effective measures.
The details of the measure need to be unambiguously defined and documented. Templates for the specification of measures and indicators are available on the PSM website and in (Goethert and Siviy 2004).
Perform Systems Engineering Measurement
This activity focuses on collection and preparation of measurement data, measurement analysis, and the presentation of the results to inform decision making. The preparation of the measurement data includes verification, normalization, and aggregation of the data, as applicable. Analysis includes estimation, feasibility analysis of plans, and performance analysis of actual data against plans.
The quality of the measurement results is dependent on the collection and preparation of valid, accurate, unbiased data. Data verification, validation, preparation, and analysis techniques are discussed in (PSM August 18, 2011), Chapters 1 and 4 and (SEI 2006, 10). Per TL 9000, Quality Management System Guidance, “The analysis step should integrate quantitative measurement results and other qualitative project information, in order to provide managers the feedback needed for effective decision making.” (Quest 2010, 5-10) This provides richer information that gives the users the broader picture and puts the information in the appropriate context.
There is a significant body of guidance available on good ways to present quantitative information. Edward Tufte has several books focused on the visualization of information, including (Tufte 2001).
More information about understanding and using measurement results can be found in:
- (PSM August 18, 2011)
- (ISO/IEC/IEEE 15939), clauses 4.3.3 and 4.3.4
- (Roedler and Jones 2005), sections 6.4, 7.2, and 7.3
Evaluate Systems Engineering Measurement
This activity includes the knowledge explaining the periodic evaluation and improvement of the measurement process and specific measures. One objective is to ensure that the measures continue to align with the business goals and information needs, and provide useful insight. Refer to (PSM August 18, 2011) and (McGarry and et al. 2002) for additional detail.
Systems Engineering Leading Indicators
Leading indicators are aimed at providing predictive insight regarding an information need. A systems engineering leading indicator “is a measure for evaluating the effectiveness of a how a specific activity is applied on a project in a manner that provides information about impacts that are likely to affect the system performance objectives.” Leading indicators may be individual measures or collections of measures and associated analysis that provide future systems engineering performance insight throughout the life cycle of the system. “Leading indicators support the effective management of systems engineering by providing visibility into expected project performance and potential future states.”
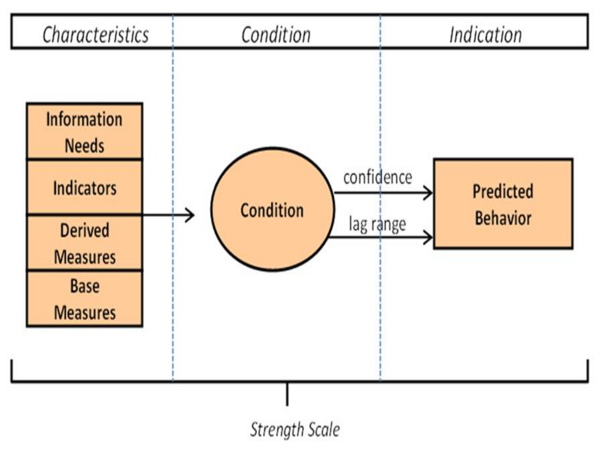
As shown in Figure 2, a leading indicator is composed of characteristics, a condition and a predicted behavior. The characteristics and condition are analyzed on a periodic or as-needed basis to predict behavior within a given confidence and within an accepted time range into the future. More information is found in (Roedler et al. 2010).
Figure 2. Composition of a Leading Indicator (Source: Roedler et al. 2010)
Technical Measurement
Technical measurement is the set of measurement activities used to provide information about progress in the definition and development of the technical solution, ongoing assessment of the associated risks and issues, and the likelihood of meeting the critical objectives of the acquirer. This insight helps make better decisions throughout the life cycle to increase the probability of delivering a technical solution that meets both the specified requirements and the mission needs. The insight is also used in trade-off decisions when performance is not within the thresholds or goals.
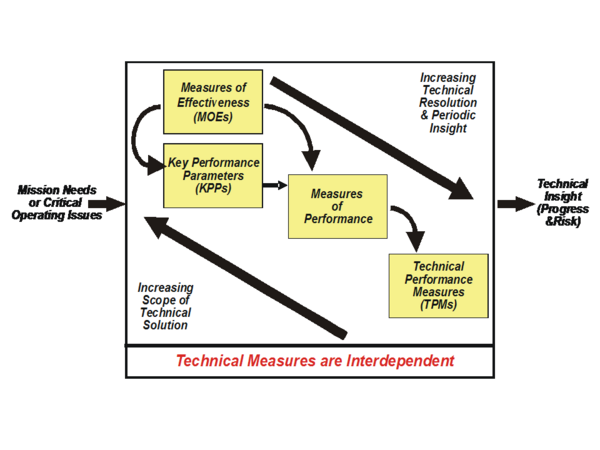
Technical measurement includes measures of effectiveness (MOEs), measures of performance (MOPs), and technical performance measures (TPMs). ((Roedler and Jones 2005, 1-65) The relationships between these types of technical measures are shown in Figure 3 and explained in the reference. Using the measurement process described above, technical measurement can be planned early in the life cycle and then performed throughout the life cycle with increasing levels of fidelity as the technical solution is developed, facilitating predictive insight and preventive or corrective actions. More information about technical measurement can be found in (NASA December 2007, 1-360, Section 6.7.2.2; Wasson 2006, Chapter 34), and (Roedler and Jones 2005).
Figure 3. Relationship of the Technical Measures (Source: (Roedler and Jones 2005)
Service Measurement
The same measurement activities can be applied for service measurement: however, the context and measures will be different. Service providers have a need to balance efficiency and effectiveness, which may be opposing objectives. Good service measures are outcome-based, focus on elements important to the customer (such as service availability, reliability and performance) and provide timely, forward-looking information.
For services, the terms critical success factors (CSF) and key performance indicators (KPI) are used often when discussing measurement. CSFs are the key elements of the service or service infrastructure that are most important to achieve the business objectives. Key performance indicators are specific values or characteristics measured to assess achievement of those objectives. More information about service measurement can be found in the Service Design and Continual Service Improvement volumes of (BMP 2010, 1). Service SE can be found in the Service Systems Engineering article.
Linkages to Other Systems Engineering Management Topics
SE Measurement has linkages to the other SEM topics. The following are a few key linkages adapted from (Roedler and Jones 2005):
- Planning – SE measurement provides the historical data and supports the estimation for and feasibility analysis of the plans for realistic planning.
- Assessment and Control – SE measurement provides the objective information needed to performed the assessment and determine appropriate control actions. The use of leading indicators allows for early assessment and control actions that identify risks and/or provide insight to allow early treatment of risks to minimize potential impacts.
- Risk Management – SE risk management identifies the information needs that can impact project and organizational performance. SE measurement data helps to quantify risks and subsequently provides information about whether risks have been successfully managed.
- Decision Management – SE Measurement results inform decision making by providing objective insight.
Practical Considerations
Key pitfalls and good practices related to systems engineering measurement are described in the next two sections.
Pitfalls
Some of the key pitfalls encountered in planning and performing SE Measurement are:
| Pitfall Name | Pitfall Description |
|---|---|
| Golden Measures |
|
| Single-pass Perspective |
|
| Unknown Information Need |
|
| Inappropriate Usage |
|
Good Practices
Some good practices, gathered from the references:
| Good Practice Name | Good Practice Description |
|---|---|
| Periodic Review |
|
| Action Driven |
|
| Integration into Project Processes |
|
| Timely Information |
|
| Relevance to Decision Makers |
|
| Data Availability |
|
| Historical Data |
|
| Information Model |
|
Additional information can be found in (Frenz et al. 2010), Section 4.2 and (INCOSE 2010, Section 5.7.1.5).
References
Please make sure all references are listed alphabetically and are formatted according to the Chicago Manual of Style (15th ed). See the BKCASE Reference Guidance for additional information.
Citations
List all references cited in the article. Note: SEBoK 0.5 uses Chicago Manual of Style (15th ed). See the BKCASE Reference Guidance for additional information.
- Frenz, Paul et al. 2010. INCOSE Systems Engineering Measurement Primer. San Diego, CA: International Council on System Engineering.
- ISO/IEC/IEEE. 2007. Systems and software engineering - Measurement process. Geneva, Switzerland: International Organization for Standardization (ISO)/International Electrotechnical Commission (IEC), ISO/IEC/IEEE 15939:2007.
- Kasunic, Mark and Anderson, William. 2004. Measuring Systems Interoperability: Challenges and Opportunities. Pittsburgh, PA, USA: Software Engineering Institute (SEI)/Carnegie Mellon University (CMU).
- McGarry, John et al. 2002. Practical Software Measurement: Objective Information for Decision Makers, Addison-Wesley
- Murdoch, John et al. 2006. Safety Measurement, Version 3.0. Practical Software and Systems Measurement.
- Murdoch, John et al. 2006. Security Measurement, Version 3.0. Practical Software and Systems Measurement.
- NASA. December 2007. NASA Systems Engineering Handbook. Washington, D.C.: National Aeronautics and Space Administration (NASA), NASA/SP-2007-6105.
- Park, Goethert, and Florac. 1996. Goal-Driven Software Measurement – A Guidebook. CMU/SEI-96-BH-002. Pittsburgh, PA, USA: Software Engineering Institute (SEI)/Carnegie Mellon University (CMU).
- PSM. 2011. Practical Software and Systems Measurement (PSM) web site, August 18, 2011.
- PSM. 2000. Practical Software and Systems Measurement (PSM) Guide, Version 4.0c. Practical Software and System Measurement Support Center.
- Roedler, G., D. Rhodes, C. Jones, and H. Schimmoller. 2010. Systems Engineering Leading Indicators Guide, version 2.0. San Diego, CA: International Council on Systems Engineering (INCOSE), INCOSE-TP-2005-001-03.
- Roedler, Garry, Jones, Cheryl. 2005. Technical Measurement Guide, Version 1.0. San Diego, CA: International Council on Systems Engineering (INCOSE), INCOSE-TP-2003-020-01.
- Software Productivity Center, Inc. 2011. Software Productivity Center web site. August 20, 2011.
- Statz, Joyce, et al. 2005. Measurement for Process Improvement, Version 1.0, Practical Software and Systems Measurement.
- Tufte, Edward. 2006. The Visual Display of Quantitative Information. Graphics Press. Cheshire, CT, USA.
- Wasson, Charles. 2005. System Analysis, Design, Development: Concepts, principles, and practices. John Wiley and Sons. Hoboken, NJ, USA.
Primary References
All primary references should be listed in alphabetical order. Remember to identify primary references by creating an internal link using the ‘’’reference title only’’’ (title). Please do not include version numbers in the links.
- Frenz, Paul et al. 2010. INCOSE Systems Engineering Measurement Primer. San Diego, CA: International Council on System Engineering.
- ISO/IEC/IEEE. 2007. Systems and software engineering - Measurement process. Geneva, Switzerland: International Organization for Standardization (ISO)/International Electrotechnical Commission (IEC), ISO/IEC/IEEE 15939:2007.
- PSM. 2011. Practical Software and Systems Measurement (PSM) web site, August 18, 2011.
- PSM. 2000. Practical Software and Systems Measurement (PSM) Guide, Version 4.0c. Practical Software and System Measurement Support Center.
- Roedler, G., D. Rhodes, C. Jones, and H. Schimmoller. 2010. Systems Engineering Leading Indicators Guide, version 2.0. San Diego, CA: International Council on Systems Engineering (INCOSE), INCOSE-TP-2005-001-03.
- Roedler, Garry, Jones, Cheryl. 2005. Technical Measurement Guide, Version 1.0. San Diego, CA: International Council on Systems Engineering (INCOSE), INCOSE-TP-2003-020-01.
Additional References
All additional references should be listed in alphabetical order.
- Kasunic, Mark and Anderson, William. 2004. Measuring Systems Interoperability: Challenges and Opportunities. Pittsburgh, PA, USA: Software Engineering Institute (SEI)/Carnegie Mellon University (CMU).
- Murdoch, John et al. 2006. Safety Measurement, Version 3.0. Practical Software and Systems Measurement.
- Murdoch, John et al. 2006. Security Measurement, Version 3.0. Practical Software and Systems Measurement.
- McGarry, John et al. 2002. Practical Software Measurement: Objective Information for Decision Makers, Addison-Wesley. Reading, MA, USA.
- NASA. December 2007. NASA Systems Engineering Handbook. Washington, D.C.: National Aeronautics and Space Administration (NASA), NASA/SP-2007-6105.
- Park, Goethert, and Florac. 1996. Goal-Driven Software Measurement – A Guidebook. CMU/SEI-96-BH-002. Pittsburgh, PA, USA: Software Engineering Institute (SEI)/Carnegie Mellon University (CMU).
- SEI. 2007. [[Capability Maturity Model Integrated (CMMI) for Development, version 1.2, measurement and analysis process area. Pittsburgh, PA, USA: Software Engineering Institute (SEI)/Carnegie Mellon University (CMU).
- Software Productivity Center, Inc. 2011. [[Software Productivity Center web site. August 20, 2011.
- Statz, Joyce, et al. 2005. Measurement for Process Improvement]], Version 1.0, Practical Software and Systems Measurement.
- Tufte, Edward. 2006. The Visual Display of Quantitative Information. Graphics Press. Cheshire, CT, USA.
- Wasson, Charles. 2005. System Analysis, Design, Development: Concepts, principles, and practices. John Wiley and Sons. Hoboken, NJ, USA.
Article Discussion
Signatures
--Groedler 01:21, 30 August 2011 (UTC)


