Uncategorized files
Jump to navigation
Jump to search
Showing below up to 250 results in range #101 to #350.
View (previous 250 | next 250) (20 | 50 | 100 | 250 | 500)
 ESE-F12.png 1,491 × 1,040; 63 KB
 ESE-F13.png 1,477 × 655; 56 KB
 ESE-F14.png 908 × 452; 88 KB
 ESE-F15.png 1,337 × 533; 256 KB
 ESE-F16.png 1,342 × 942; 412 KB
 ESE-F17.png 1,337 × 1,050; 68 KB
 ESE-F18.png 471 × 602; 276 KB
 ESE-F19.png 728 × 409; 33 KB
 ESE-F20.png 1,294 × 652; 48 KB
 ESE-F21.png 744 × 455; 52 KB
 ESE-F22.png 1,344 × 586; 37 KB
 ESE-F23.png 784 × 472; 332 KB
 ESE-F30 Process Breakdown.png 1,271 × 1,004; 79 KB
 ESE-TA.png 912 × 439; 39 KB
 ESE-TB.png 912 × 481; 39 KB
 Editor Signature Block.png 932 × 491; 105 KB
 EditorsinChiefSignatures.png 1,640 × 446; 314 KB
- Error creating thumbnail: File missingEleni Canez.jpg 116 × 139; 5 KB
 Ellipse Graphic J Ring.png 2,866 × 1,485; 576 KB
 EnablingSEFigure.png 900 × 566; 67 KB
 Enterprise-ontology.PNG 650 × 337; 23 KB
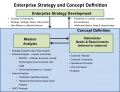 Enterprise Strategy and Concept Development.PNG 1,330 × 1,015; 194 KB
 Environmental Engineering HighRes.jpg 460 × 292; 71 KB
 Eq 1.jpg 2,050 × 1,025; 52 KB
 Eq 2.jpg 2,200 × 1,700; 153 KB
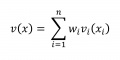
 Equation 1 DM.png 86 × 35; 2 KB
- Error creating thumbnail: File missingEquation 1 Value DM.png 676 × 267; 44 KB
 Evolutionary Generic Model.PNG 720 × 384; 46 KB
 Ex Itera of processes related to Sys Def AF 052312.png 1,117 × 502; 85 KB
 Ex Stakeholder Value Scat DM.png 1,199 × 750; 185 KB
 Example of Architected Agile Process Replacement 070912.png 1,240 × 540; 212 KB
 Examples of validated items.png 964 × 795; 260 KB
 Examples of verified items.png 1,051 × 762; 145 KB
 Fairley Fig 1 (2) Layer 1.png 439 × 205; 8 KB
 Fairley Fig 2 Layer 1.png 450 × 227; 12 KB
 Fault tree.jpg 519 × 526; 33 KB
 Fig. 1 Integration Process for Specialty Engineering.png 817 × 515; 160 KB
 Fig2 Systems Thinking and Systems Science RA.png 1,207 × 741; 107 KB
 Fig 1 A generic life cycle KF.png 1,209 × 177; 24 KB
 Fig 1 SA Activities Through Life RA.png 800 × 510; 115 KB
 Fig 1 System Fundamentals and Engineered Systems RA.png 1,445 × 1,086; 201 KB
 Fig 1 Systems Engineering and the Systems Approach RA.png 1,477 × 1,015; 224 KB
 Fig 1 Systems Science and Systems Thinking RA.png 1,196 × 1,042; 161 KB
 Fig 1 The relationships between key systems ideas and SE RA.jpg 1,497 × 1,103; 167 KB
 Fig 2 Life Cycle Stages Vee KF.png 1,316 × 979; 189 KB
 Fig 3 Complex Systems Engineering Diagram Sillitto2010.png 3,052 × 1,909; 732 KB
 Fig 3 Growing Industry Collaboration GR.png 1,402 × 967; 211 KB
 Figure1 systemsubsystem.png 1,783 × 916; 86 KB
 Figure2 MLprocess.png 2,002 × 1,104; 148 KB
- Error creating thumbnail: File missingFigure 1. Digital Engineering Systemic Framework (1).jpeg 2,062 × 2,078; 671 KB
 Figure 1. System Safety Process.png 889 × 530; 133 KB
 Figure 1.png 1,380 × 1,035; 123 KB
 Figure 2.jpg 8,400 × 5,375; 11.53 MB
- Error creating thumbnail: File with dimensions greater than 25 MPFigure 2.png 8,400 × 5,375; 869 KB
 Figure 3. Spiral Model support for Process Models, Product Models....png 1,405 × 704; 55 KB
 Fund Obj Hierarchy DM.png 1,085 × 629; 325 KB
 GMU PLogo RGB.200.png 200 × 200; 25 KB
 Ground and Marine Vehicles, Aircraft, Regulation in Organisms.png 936 × 660; 319 KB
 Hierarchical decomposition of a system-of-interest 060612.jpg 1,158 × 662; 84 KB
- Error creating thumbnail: File missingHierarchyofUnacceptableConditions.png 443 × 378; 30 KB
 HowToRead Glossary.png 1,831 × 1,018; 393 KB
 HowToRead MainContent.png 2,025 × 1,177; 584 KB
 HowToRead Menu&Search.png 1,936 × 1,337; 534 KB
 HowToRead PrimaryRef.png 2,045 × 1,144; 466 KB
 HowToRead Review.png 2,154 × 993; 409 KB
 HowToRead Starburst.png 1,503 × 881; 492 KB
- Error creating thumbnail: File missingHutchison,Nicole Profile.jpeg 1,536 × 2,048; 740 KB
- Error creating thumbnail: File missingHutchison Signature.png 553 × 97; 50 KB
 Hutchison profilephoto.png 1,022 × 1,186; 2.5 MB
 IFSR ISA July 2012 REV.png 4,000 × 2,250; 1.3 MB
 IFSR SPF.png 1,352 × 1,005; 659 KB
 IFSR SPF August 2013.jpg 689 × 513; 118 KB
 IISE BoK.jpeg 1,644 × 925; 230 KB
 INCOSE-logo-.jpg 265 × 176; 21 KB
 INCOSE-logo-2016.jpg 1,000 × 673; 248 KB
 INCOSE UK Working Group Competency Framework.png 1,700 × 2,200; 25 KB
 INCOSE UK Working Group Competency Framework NoWhiteS.png 740 × 827; 75 KB
 IPDP PSE Background Figure 1.png 960 × 720; 51 KB
 IPT-System Mapping Diagram.png 1,349 × 558; 25 KB
 Ieee systems council logo.png 220 × 193; 9 KB
 Illustration of a scenario (eFFBD) AF 071112.png 1,024 × 387; 67 KB
 Illustration of a scenario Activity Diagram AF 071112.png 1,401 × 639; 163 KB
 Images.jpg 275 × 183; 4 KB
 Inclusive-engineering-framework-new.jpeg 226 × 242; 14 KB
 Incremental Development with a single delivery.PNG 720 × 551; 69 KB
 InfoMgtProcess Fig1.png 884 × 1,053; 38 KB
 Interactions for Quality Control Processes.png 795 × 799; 642 KB
 Interdependence Examples.png 624 × 606; 1.08 MB
 Iteration through Life Cycle Stages (Lawson 2010, Figure 6-4).png 430 × 348; 41 KB
 JSTable vvcomparison.png 544 × 462; 30 KB
 JS Figure 1.png 872 × 447; 62 KB
 JS Figure 10.png 374 × 283; 9 KB
 JS Figure 11.png 945 × 560; 33 KB
 JS Figure 12.png 353 × 384; 11 KB
 JS Figure 13.png 599 × 321; 15 KB
 JS Figure 14.png 528 × 492; 28 KB
 JS Figure 15.png 540 × 514; 29 KB
 JS Figure 16.png 601 × 405; 26 KB
 JS Figure 17.png 614 × 391; 15 KB
 JS Figure 2.png 975 × 550; 540 KB
 JS Figure 3.png 724 × 527; 341 KB
 JS Figure 4.png 1,417 × 483; 36 KB
 JS Figure 5.png 878 × 385; 75 KB
 JS Figure 6.png 878 × 385; 75 KB
- JS Figure 7.pngJS Figure 7.png File missing
 JS Figure 8.png 954 × 784; 26 KB
 JS Figure 9.png 902 × 358; 12 KB
 JS Table2.png 473 × 442; 20 KB
 JS Table3.png 633 × 204; 15 KB
 JS Table 1.png 633 × 168; 12 KB
 JS Table 5.png 635 × 215; 15 KB
 JoshuaReynoldsParty.jpg 720 × 523; 133 KB
 KF Agile Architected.png 331 × 96; 26 KB
 KF Agile Scrum.png 340 × 220; 66 KB
 KF ConceptualLifeCycleTransformation.png 468 × 278; 54 KB
 KF EvolutionComponents Orbiter.png 468 × 351; 77 KB
 KF EvolutionaryConcurrentChange.png 468 × 281; 69 KB
 KF EvolutionaryGenericModel.png 468 × 229; 30 KB
 KF FeasibilityEvidenceDescription.png 356 × 165; 22 KB
 KF GenericLifeCycleStages.png 468 × 205; 33 KB
 KF GenericStageStructure.png 417 × 316; 57 KB
 KF ICSMActivityCategories.png 468 × 515; 97 KB
 KF ILSSupportingSystem.png 445 × 232; 38 KB
 KF ILSSystemLifeCycle.png 377 × 303; 41 KB
 KF Incremental&EvolDecision.png 450 × 265; 34 KB
 KF Incremental&EvolDevelopment.png 468 × 209; 52 KB
 KF IncrementalBuildCycles.png 433 × 299; 46 KB
 KF IncrementalCommitmentSpiral.png 455 × 296; 54 KB
 KF IncrementalDevelopment Multiple.png 468 × 332; 48 KB
 KF IncrementalDevelopment Single.png 468 × 358; 45 KB
 KF LifeCycleComparisons.png 468 × 433; 94 KB
 KF PartitioningCriteria.png 468 × 115; 22 KB
 KF Phase GenericIncremental.png 469 × 363; 64 KB
 KF ProgramManagement&EngineeringViews.png 358 × 240; 37 KB
 KF SchedulingDevelopment.png 412 × 265; 29 KB
 KF SoftwareDevelopmentEmphasis.png 468 × 122; 22 KB
 KF VeeModel DesignConcept.png 451 × 363; 118 KB
 KF VeeModel ExploratoryResearch.png 441 × 360; 76 KB
 KF VeeModel Left.png 830 × 618; 118 KB
 KF VeeModel Right.png 731 × 571; 107 KB
 LDSE Figure 20200702.gif 2,000 × 1,500; 97 KB
 LM logo Blue notag.200.png 200 × 200; 5 KB
 LM logo Blue notag.png 500 × 121; 2 KB
 Layered and Multi-dimensional in the Engineering Layer.PNG 512 × 384; 18 KB
 Le Ha Phuong.jpg 1,863 × 2,609; 774 KB
 Life-Cycle-Model-Purpose AdaptedfromIEEE Dove.png 733 × 712; 212 KB
 Limits of integration activities.png 609 × 642; 18 KB
 Logo SEBoK 10th.png 1,966 × 987; 431 KB
 Loss Driven Systems Engineering Figure 1.png 624 × 383; 15 KB
 MBSE Trends Figure 1.png 1,027 × 533; 22 KB
 MBSE Trends Figure 2.png 761 × 460; 17 KB
 MBSE Trends Figure 3.png 1,473 × 764; 89 KB
 MBSE Trends Figure 4.png 1,008 × 534; 96 KB
 MBSE Trends Figure 5.png 855 × 474; 43 KB
 MBSE Trends Figure 6.png 1,111 × 609; 37 KB
 MBSE Trends Figure 7.png 1,115 × 688; 27 KB
 MBSE Trends Figure 8.png 1,163 × 790; 67 KB
 MITRE Enterprise Systems Engineering Framework.PNG 625 × 384; 147 KB
 Main ontology elements as handled within validation.png 772 × 1,018; 396 KB
 Main ontology elements as handled within verification.png 769 × 1,040; 406 KB
 Major pitfalls with System Validation.png 964 × 667; 190 KB
 Major pitfalls with System Verification.png 964 × 957; 286 KB
 Major technical reviews.png 1,234 × 1,036; 359 KB
 Mapping of tech topics SEBoK with ISO IEC 15288techPro 060612.jpg 761 × 532; 121 KB
 Measurement Process Model-Figure 1.png 960 × 720; 36 KB
 Mediawiki and Caching.pdf ; 54 KB
 MissionAndCapabilities.png 1,486 × 783; 151 KB
 Missouri-S T PrimaryLogo Apple.png 1,157 × 940; 27 KB
 Model-Based System Design Process Part3.png 1,262 × 843; 171 KB
 NASA Image Part 1.png 974 × 663; 122 KB
 Needs-to-requirements-ryan.PNG 960 × 713; 74 KB
 One Spin of the Holon.jpg 960 × 720; 101 KB
 Organizational coupling diagram v2.png 962 × 577; 154 KB
 P1 EconValueSE RiskBalancedfig2 BB.jpg 327 × 403; 21 KB
 P1 Scope and Con SE and Eng Sys Proj LF BB.jpg 1,362 × 845; 145 KB
 P1 Scope and Con SEbok LC and Cont Related Agents BB.jpg 1,205 × 869; 134 KB
 P6 Fig1 The Organizational Continuum KN.jpg 1,166 × 597; 47 KB
- PDFCoverPage P7.pdf ; 9.81 MB
 PM-SE1.jpg 433 × 289; 11 KB
 PM-SE2.jpg 1,009 × 290; 29 KB
 PPI.png 1,200 × 280; 59 KB
 PPI Logo Square.png 1,000 × 764; 34 KB
 PPI Youtube Six-Myths-of-Systems-Engineering final v2.png 2,268 × 1,276; 1.3 MB
 PSE Intro Fig1.png 960 × 720; 55 KB
 PSE Intro Fig2.png 960 × 720; 94 KB
 PSE Intro Fig3.png 960 × 720; 10 KB
 PSE Intro Fig4.png 960 × 720; 13 KB
 PSE PAAS Fig1.png 960 × 720; 80 KB
 PSE PAAS Fig2.png 960 × 720; 36 KB
 PSE PSEB Fig1.png 1,920 × 2,592; 148 KB
 PSE PSEB Fig2.png 960 × 720; 31 KB
 PSE PSEB Tab1.png 960 × 720; 11 KB
 PSE PSEKA Fig1.png 960 × 720; 118 KB
 PSE PSEKA Fig2.png 960 × 720; 12 KB
 PSE PSEKA Fig3.png 960 × 720; 143 KB
 PSE PSEKA Fig4.png 960 × 720; 68 KB
 PSE PSESA Fig1.png 960 × 720; 155 KB
 PSE PSESA Tab1.png 960 × 720; 17 KB
 Part2 Environment 201905.jpg 640 × 518; 67 KB
 Part2 ModifiedCapabilityEngineering 201905.png 1,309 × 882; 122 KB
 Part2 ServiceSystem 201905.png 1,407 × 1,142; 431 KB
 Part2 ServiceSystemofInterest 201905.png 1,466 × 1,111; 521 KB
- Part 2.pdf ; 778 KB
 Part 5 (Organization) Concept maps additions hgs 15 Aug.png 960 × 720; 36 KB
- Part 6.pdf ; 1.1 MB
 Pdf.png 128 × 128; 10 KB
 Picture1.png 1,502 × 1,055; 158 KB
 Picture1 HGS.png 1,502 × 1,112; 323 KB
 Png.jpg 225 × 225; 6 KB
 Proven practices with System Validation.png 763 × 1,050; 362 KB
 Proven practices with System Verification.png 964 × 703; 208 KB
 QQBKCASE Sect 2.5 Fig 6C.png 2,000 × 1,500; 62 KB
 Recursion of processes on layers 060612.jpg 1,158 × 849; 90 KB
 Recursive Instantiation of Def Process AF 071112.png 1,343 × 827; 225 KB
 References Image.png 1,071 × 143; 21 KB
 RelatingACQtoRFP.png 720 × 540; 167 KB
 RelatingACQtoRFP NoWhiteS.png 721 × 542; 373 KB
 Relating ACQ to Req for Prop and Tech Atts p6.jpg 662 × 469; 929 KB


_Layer_1.png)


_Stage_Structure_of_System_Life_Cycle_Models_(Lawson_2010,_Figure_6-2).png)


.png)


_Concept_maps_additions_hgs_15_Aug.png)


.jpeg)
_AF_071112.png)